Market Outlook
September 9, 2016
Market Cues
Domestic Indices
Chg (%)
(Pts)
(Close)
Indian markets are likely to open negative taking global cues
BSE Sensex
0.4
119
29,045
Nifty
0.4
35
8,953
US markets continued to remain weak for the day. Market has remained range
bound for the last two trading session due to lack of major economic data. This
Mid Cap
0.1
20
13,479
together with status quo by ECB on its monetary policy led to marginal selling in the
Small Cap
0.8
106
12,922
index.
Bankex
(0.0)
(9)
23,487
European markets ended mixed as there was no change in monetary policy by ECB.
The ECB left key interest rates unchanged for the fourth consecutive session. Though
Global Indices
Chg (%)
(Pts)
(Close)
the decisions were in line with market expectations, markets remained directionless.
Dow Jones
(0.2)
(46)
18,480
The Indian markets remained volatile with narrow range initially, but picked up
Nasdaq
(0.5)
(24)
5,259
momentum later on and ended the day with a modest gain. Pharma and auto stocks
FTSE
0.2
12
6,859
saw buying interest during the day.
Nikkei
(0.3)
(54)
16,959
News Analysis
Hang Seng
0.7
178
23,919
SAIL posts `535 cr loss for the quarter.
Shanghai Com
0.1
4
3,096
Detailed analysis on Pg2
Investor’s Ready Reckoner
Advances / Declines
BSE
NSE
Key Domestic & Global Indicators
Advances
1,613
998
Declines
1,175
609
Stock Watch: Latest investment recommendations on 150+ stocks
Refer Pg5 onwards
Unchanged
183
78
Top Picks
Volumes (` Cr)
CMP
Target
Upside
Company
Sector
Rating
(`)
(`)
(%)
BSE
3,979
HCL Tech
IT
Buy
774
1,000
29.3
NSE
25,426
Bharat Electronics
Capital Goods
Buy
1,203
1,414
17.6
Equitas Holdings
Financials
Buy
185
235
27.0
Buy
188
265
41.1
Net Inflows (` Cr)
Net
Mtd
Ytd
Navkar Corporation Others
More Top Picks on Pg3
FII
864
2,121
42,790
MFs
(94)
196
10,304
Key Upcoming Events
Previous
Consensus
Date
Region
Event Description
Reading
Expectations
Top Gainers
Price (`)
Chg (%)
Sep 09 Euro
ECB announces interest rates
-
-
J&Kbank
79
11.0
Sep 09 India
Industrial Production YoY
2.10
1.90
Hcc
36
10.0
Sep 13 UK
Jobless claims change
(8.60)
(4.00)
Sep 13 UK
CPI (YoY)
0.60
0.70
Irb
252
9.1
Sep 14 China
Industrial Production (YoY)
6.00
6.20
Marksans
45
8.5
Sep 14 India
Monthly Wholesale Prices YoY%
3.55
4.04
6.(
Cox&Kings
205
8.0
More Events on Pg4
Top Losers
Price (`)
Chg (%)
Yesbank
1,331
(5.3)
Tcs
2,321
(5.1)
Religare
272
(4.5)
Alstomt&D
321
(3.9)
Techm
459
(2.6)
As on September 08, 2016
Market Outlook
September 9, 2016
News Analysis
SAIL posts `535cr loss
Steel Authority of India’s net loss for the June quarter widened to `535cr, mainly
on account of an exceptional item after the company paid `54.2cr towards
voluntary retirement compensation during the period. This is the fourth consecutive
quarter when the maharatna firm has posted a loss. The state-run steelmaker had
reported a net loss of `248cr in the corresponding period of the previous financial
year.
Company’s total income from operations was down to `9,238cr from `9,493cr in
the year-ago period. The steelmaker had posted a net loss of `1,231cr for the
March quarter, hit by challenging market conditions and decline in sales
realisation. During the period, SAIL had spent about 25% of planned capital
expenditure for current financial year.
All major facilities of its steel plants at Rourkela, IISCO, Durgapur, Bokaro and
Salem have been modernised or completed and are under operation/stabilisation,
commenced and the balance modernisation of Bhilai Steel Plant would be
completed in the next few months which would improve SAIL’s production capacity
to around 20 metric tn of saleable steel. SAIL slipped into red in the September
quarter of the previous financial year due to lower sales realisation. Even though
the government has extended support to the Indian steel makers in the form of
minimum support price and anti-dumping duty, the domestic and international
market continues to pose challenge to the indigenous steel makers.
Economic and Political News
Reliance Jio and Incumbent players to meet TRAIL today.
Upto 75% equity in private NSP allowed
GST gets presedential nod
Corporate News
Maruti to consider stock split
Ola to raise Fleet by 40,000 after Mahindra tie up
TCS profit warnings shows weak demand
Yes Bank defers $1bn QIP
Quarterly Bloomberg Brokers Consensus Estimate
Coal India Ltd Consol - Sept 11, 2016
Particulars (` cr)
1QFY17E
1QFY16
y-o-y (%)
4QFY16
q-o-q (%)
Net sales
18,963
18,956
0.0
20,759
(8.7)
EBITDA
4,881
4,944
(1.3)
5,534
(11.8)
EBITDA margin (%)
25.7
26.1
26.7
Net profit
3,628
3,764
(3.6)
4,248
(14.6)
Market Outlook
September 9, 2016
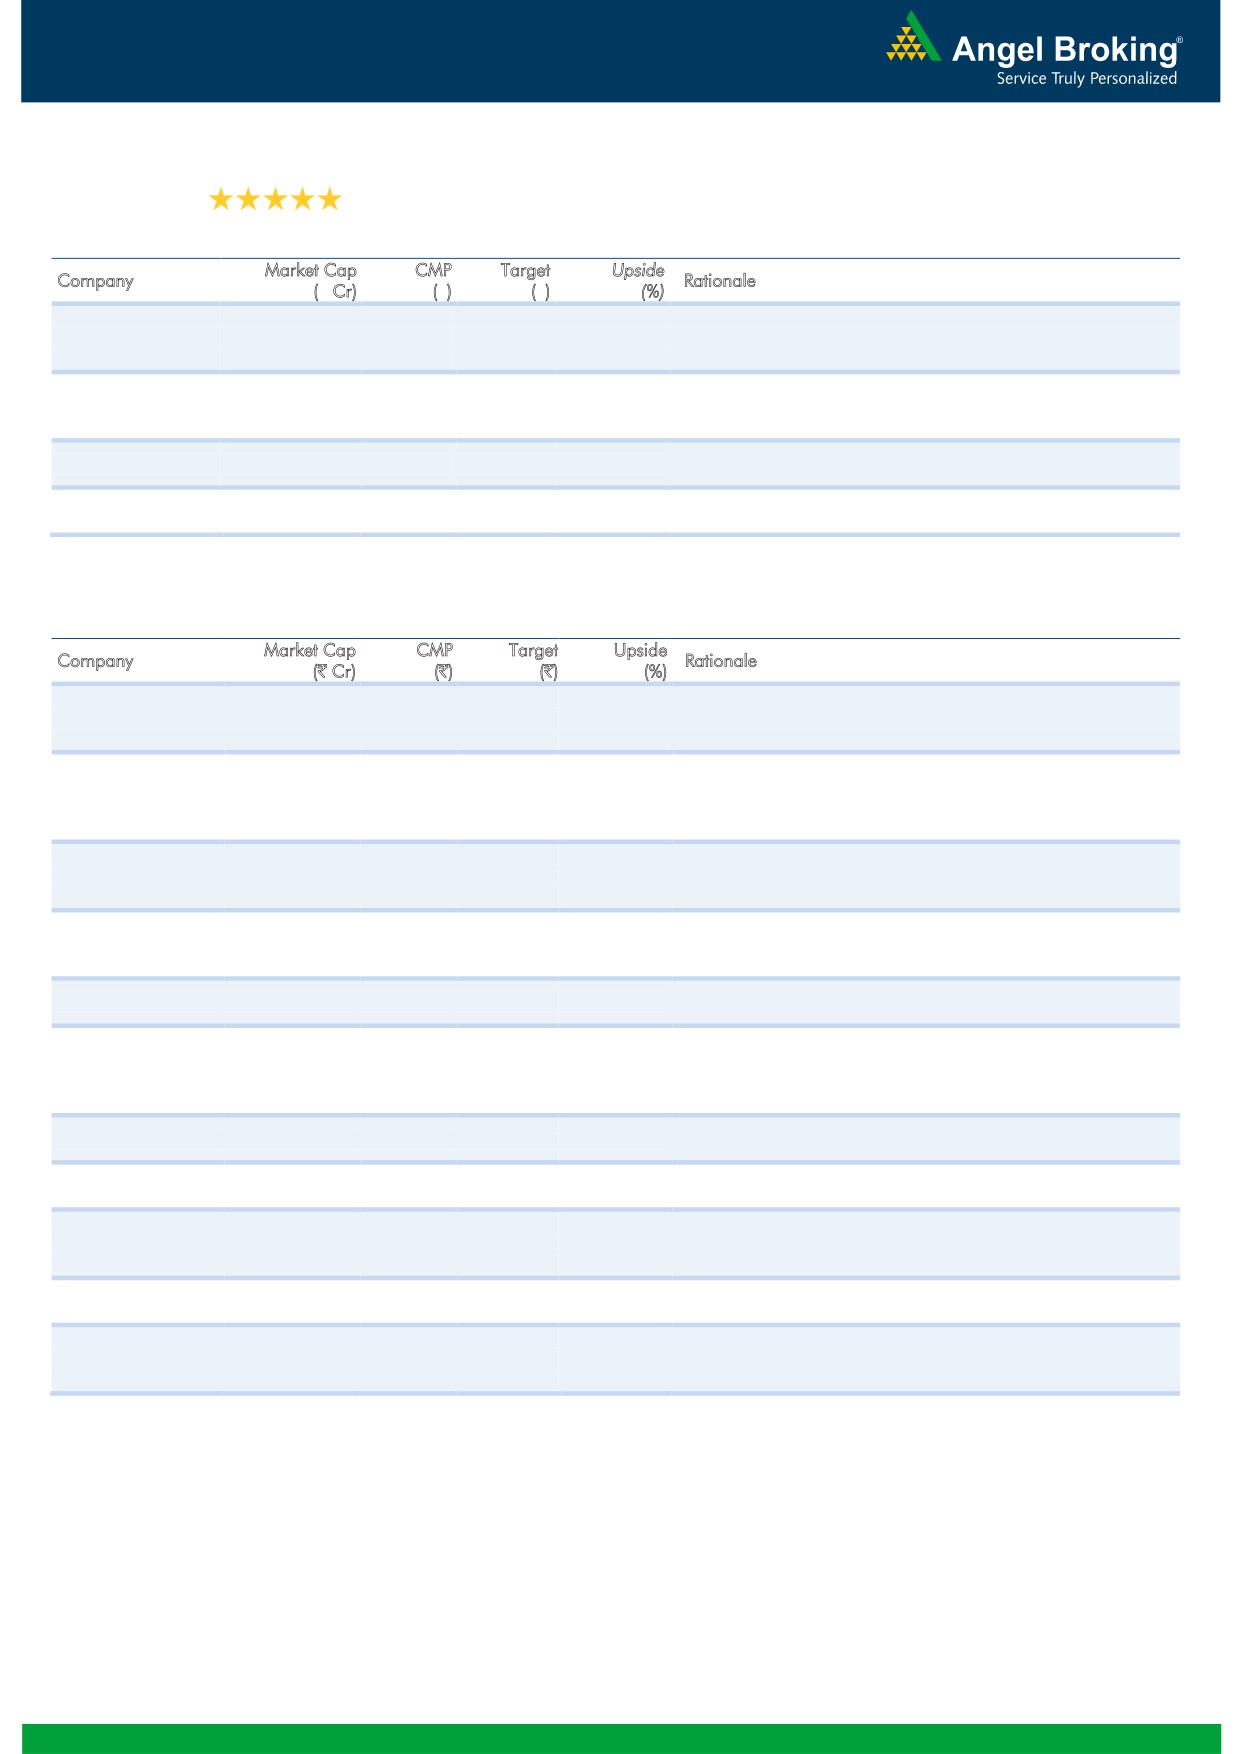
Top Picks
Large Cap
M
arket Cap
CM
P
T
arget
Upsid
e
Company
Rationale
(` Cr)
(`)
(`)
(%)
To outpace battery industry growth due to better technological
Amara Raja Batteries
17,526
1,026
1,174
14.4products leading to market share gains in both the automotive
OEM and replacement segments.
Uptick in defense capex by government when coupled with BELs
Bharat Electronics
28,864
1,203
1,414
17.6strong market positioning, indicate that good times are ahead for
BEL.
The stock is trading at attractive valuations and is factoring all the
HCL Tech
1,09,129
774
1,000
29.3
bad news.
Back on the growth trend, expect a long term growth of 14% to be
Infosys
2,38,400
1,038
1,370
32.0
a US$20bn in FY2020.
Source: Company, Angel Research
Mid Cap
M
arket Cap
CM
P
T
arget
Upsid
e
Company
Rationale
(` Cr)
(`)
(`)
(%)
Among the top 4 players in the consumer durables segment.
Bajaj Electricals
2,750
272
306
12.5Improved profitability backed by turn around in E&P segment.
Strong order book lends earnings visibility.
Favourable outlook for the AC industry to augur well for Cooling
products business which is out pacing the market growth. EMPPAC
Blue Star
4,984
523
578
10.5
division's profitability to improve once operating environment
turns around.
Strong loan growth backed by diversified loan portfolio and
Equitas Holdings
6,208
185
235
27.0adequate CAR. ROE & ROA likely to remain decent as risk of
dilution remains low. Attractive valuations considering growth.
Expectations of above average monsoon augurs well for
Goodyear India
1,417
614
684
11.4Goodyear India as it derives ~50% of its turnover from farm tyre
segment.
Commencement of new projects, downtrend in the interest rate
IL&FS Transport
2,617
80
93
16.9
cycle, to lead to stock re-rating
Economic recovery to have favourable impact on advertising &
circulation revenue growth. Further, the acquisition of a radio
Jagran Prakashan
6,762
207
225
8.8
business (Radio City) would also boost the company's revenue
growth.
Speedier execution and speedier sales, strong revenue visibilty in
Mahindra Lifespace
1,788
436
522
19.8
short-to-long run, attractive valuations
Massive capacity expansion along with rail advantage at ICD as
Navkar Corporation
2,678
188
265
41.1
well CFS augurs well for the company
Earnings boost on back of stable material prices and favourable
Radico Khaitan
1,396
105
125
19.2pricing environment. Valuation discount to peers provides
additional comfort
Strong brands and distribution network would boost growth going
Siyaram Silk Mills
1,214
1,295
1,469
13.5
ahead. Stock currently trades at an inexpensive valuation.
Market leadership in Hindi news genre and no. 2 viewership
TV Today Network
1,879
315
363
15.2ranking in English news genre, exit from the radio business, and
anticipated growth in ad spends by corporates to benefit the stock.
Source: Company, Angel Research
Market Outlook
September 09, 2016
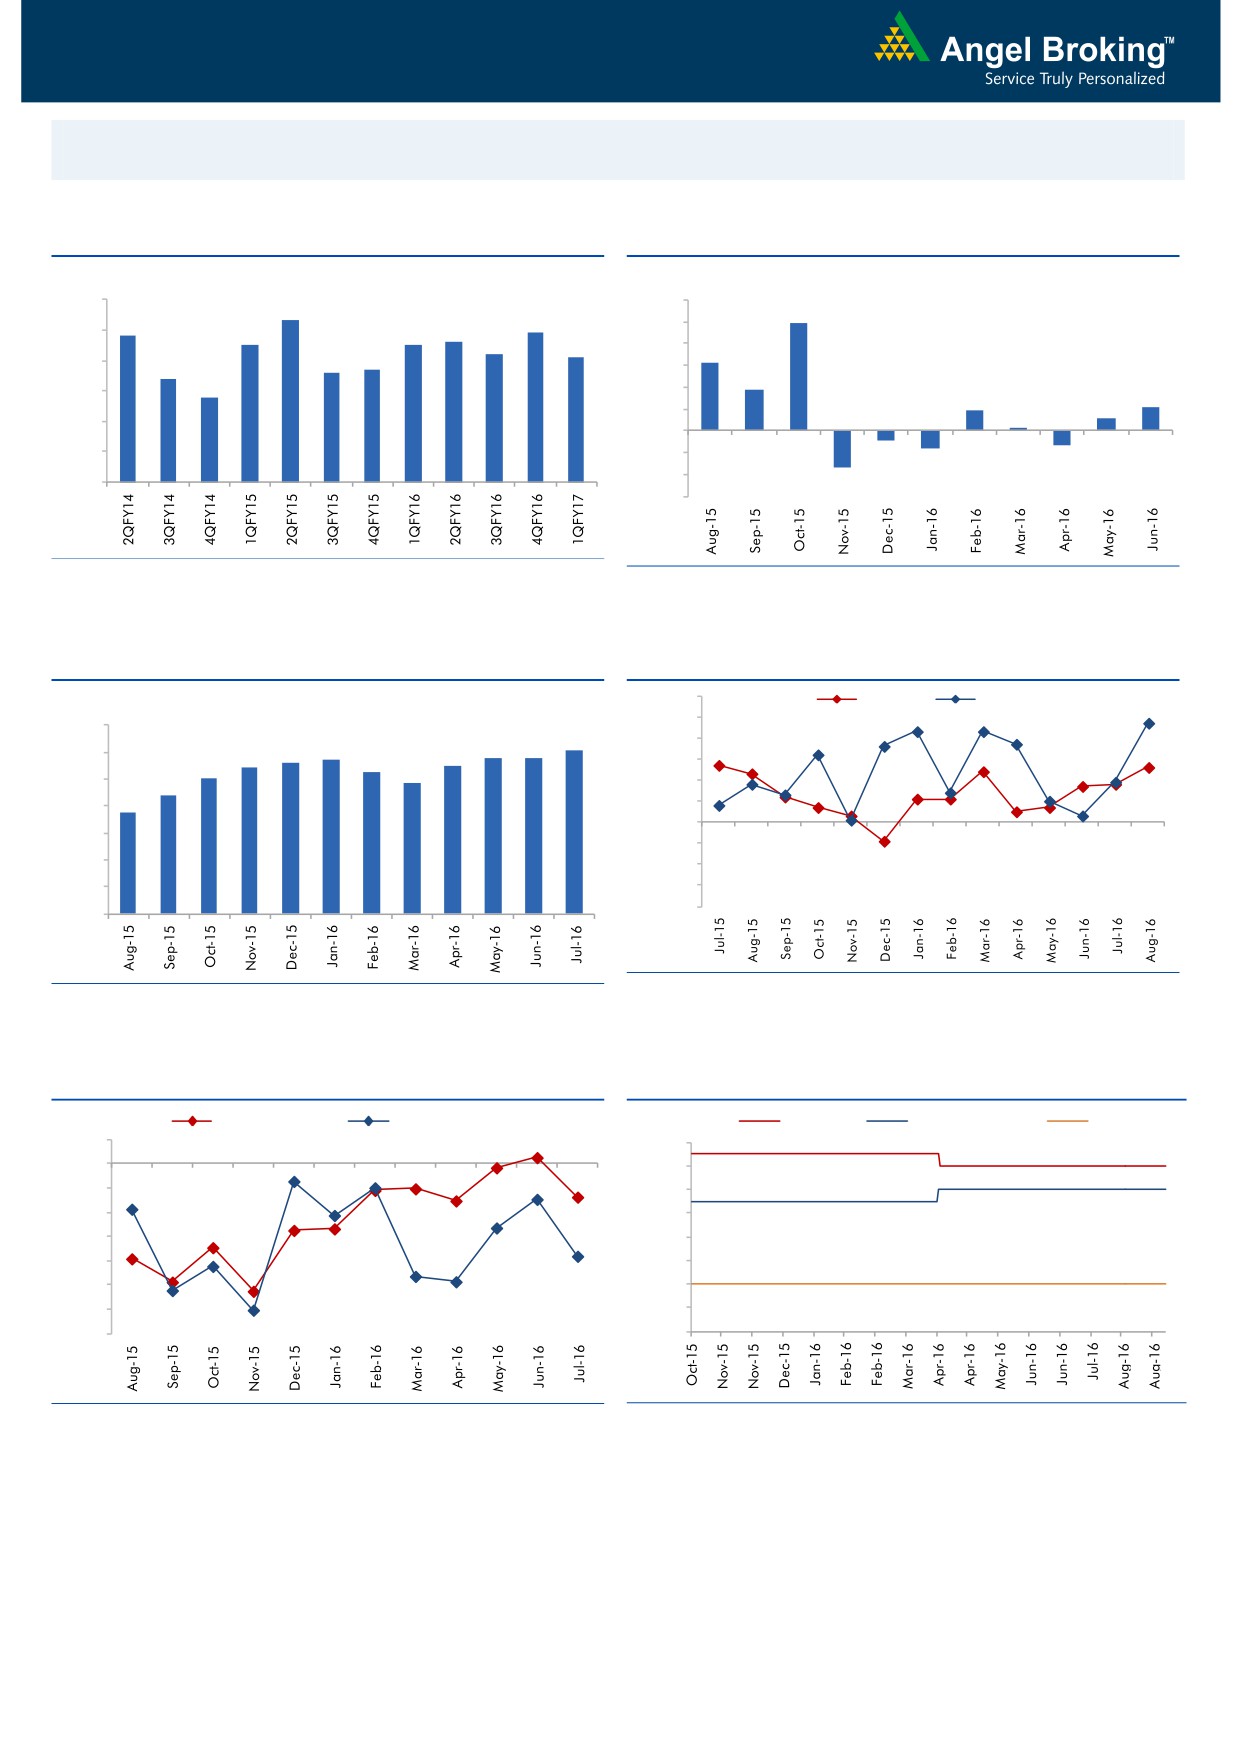
Macro watch
Exhibit 1: Quarterly GDP trends
Exhibit 2: IIP trends
(%)
(%)
9.0
8.3
12.0
9.9
7.8
7.9
10.0
8.0
7.5
7.5
7.6
7.2
7.1
8.0
6.3
6.6
6.7
7.0
6.4
6.0
3.7
5.8
4.0
2.1
6.0
1.9
1.1
2.0
0.3
5.0
-
4.0
(2.0)
(0.9)
(1.3)
(1.6)
(4.0)
3.0
(3.4)
(6.0)
Source: CSO, Angel Research
Source: MOSPI, Angel Research
Exhibit 3: Monthly CPI inflation trends
Exhibit 4: Manufacturing and services PMI
56.0
Mfg. PMI
Services PMI
(%)
55.0
7.0
6.1
54.0
5.7
5.8
5.8
6.0
5.4
5.6
5.5
5.3
53.0
5.0
4.8
5.0
4.4
52.0
3.7
51.0
4.0
50.0
3.0
49.0
2.0
48.0
1.0
47.0
46.0
-
Source: Market, Angel Research; Note: Level above 50 indicates expansion
Source: MOSPI, Angel Research
Exhibit 5: Exports and imports growth trends
Exhibit 6: Key policy rates
(%)
Exports yoy growth
Imports yoy growth
(%)
Repo rate
Reverse Repo rate
CRR
5.0
7.00
0.0
6.50
(5.0)
6.00
(10.0)
5.50
(15.0)
5.00
(20.0)
4.50
(25.0)
4.00
(30.0)
3.50
(35.0)
3.00
Source: Bloomberg, Angel Research
Source: RBI, Angel Research
Market Outlook
September 09, 2016
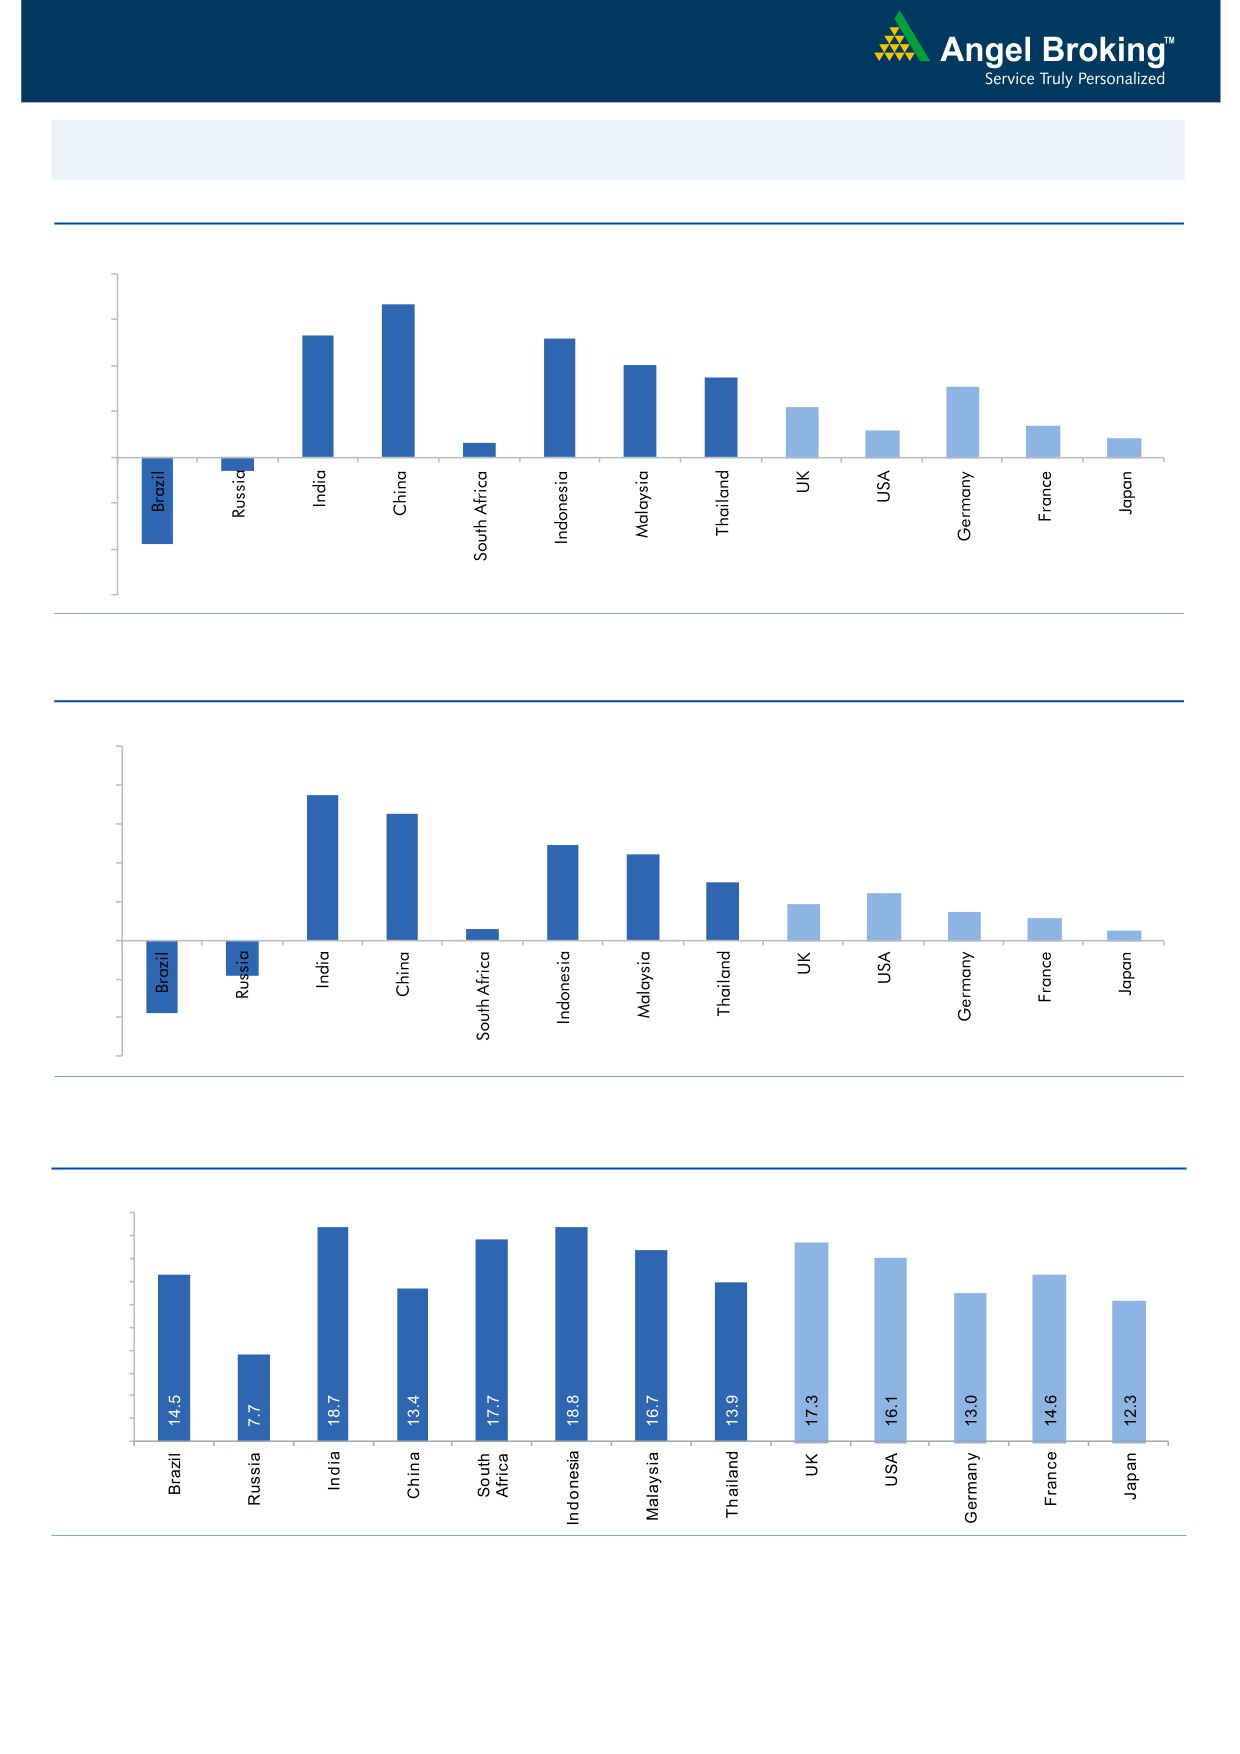
Global watch
Exhibit 1: Latest quarterly GDP Growth (%, yoy) across select developing and developed countries
(%)
8.0
6.7
6.0
5.3
0.6
5.2
4.0
3.5
4.0
3.1
2.2
1.4
2.0
1.2
0.8
-
(2.0)
(0.6)
(4.0)
(3.8)
(6.0)
Source: Bloomberg, Angel Research
Exhibit 2: 2016 GDP Growth projection by IMF (%, yoy) across select developing and developed countries
(%)
10.0
7.5
8.0
6.5
6.0
4.9
4.4
4.0
3.0
2.4
1.9
1.5
2.0
1.1
0.6
0.5
(3.8)
(1.8)
-
(2.0)
(4.0)
(6.0)
Source: IMF, Angel Research
Exhibit 3: One year forward P-E ratio across select developing and developed countries
(x)
20.0
18.0
16.0
14.0
12.0
10.0
8.0
6.0
4.0
2.0
-
Source: IMF, Angel Research
Market Outlook
September 09, 2016
Exhibit 4: Relative performance of indices across globe
Returns (%)
Country
Name of index
Closing price
1M
3M
1YR
Brazil
Bovespa
60,232
4.3
16.5
32.2
Russia
Micex
2,051
4.7
5.9
19.5
India
Nifty
8,953
3.1
8.3
12.3
China
Shanghai Composite
3,096
2.3
5.8
(3.4)
South Africa
Top 40
46,589
2.2
(3.2)
7.2
Mexico
Mexbol
47,417
0.1
3.8
10.9
Indonesia
LQ45
925
(1.7)
11.8
22.2
Malaysia
KLCI
1,691
1.1
2.6
5.1
Thailand
SET 50
928
(5.6)
0.8
3.8
USA
Dow Jones
18,480
(0.1)
3.3
14.0
UK
FTSE
6,859
0.7
10.1
12.1
Japan
Nikkei
16,959
1.9
0.8
(11.4)
Germany
DAX
10,675
0.4
9.2
6.0
France
CAC
4,542
1.9
5.7
(2.2)
Source: Bloomberg, Angel Research
Market Outlook
September 9, 2016
Research Team Tel: 022 - 39357800
DISCLAIMER
Angel Broking Private Limited (hereinafter referred to as “Angel”) is a registered Member of National Stock Exchange of India Limited,
Bombay Stock Exchange Limited and Metropolitan Stock Exchange Limited. It is also registered as a Depository Participant with CDSL
and Portfolio Manager with SEBI. It also has registration with AMFI as a Mutual Fund Distributor. Angel Broking Private Limited is a
registered entity with SEBI for Research Analyst in terms of SEBI (Research Analyst) Regulations, 2014 vide registration number
INH000000164. Angel or its associates has not been debarred/ suspended by SEBI or any other regulatory authority for accessing
/dealing in securities Market. Angel or its associates/analyst has not received any compensation / managed or co-managed public
offering of securities of the company covered by Analyst during the past twelve months.
This document is solely for the personal information of the recipient, and must not be singularly used as the basis of any investment
decision. Nothing in this document should be construed as investment or financial advice. Each recipient of this document should make
such investigations as they deem necessary to arrive at an independent evaluation of an investment in the securities of the companies
referred to in this document (including the merits and risks involved), and should consult their own advisors to determine the merits and
risks of such an investment.
Reports based on technical and derivative analysis center on studying charts of a stock's price movement, outstanding positions and
trading volume, as opposed to focusing on a company's fundamentals and, as such, may not match with a report on a company's
fundamentals. Investors are advised to refer the Fundamental and Technical Research Reports available on our website to evaluate the
contrary view, if any.
The information in this document has been printed on the basis of publicly available information, internal data and other reliable
sources believed to be true, but we do not represent that it is accurate or complete and it should not be relied on as such, as this
document is for general guidance only. Angel Broking Pvt. Limited or any of its affiliates/ group companies shall not be in any way
responsible for any loss or damage that may arise to any person from any inadvertent error in the information contained in this report.
Angel Broking Pvt. Limited has not independently verified all the information contained within this document. Accordingly, we cannot
testify, nor make any representation or warranty, express or implied, to the accuracy, contents or data contained within this document.
While Angel Broking Pvt. Limited endeavors to update on a reasonable basis the information discussed in this material, there may be
regulatory, compliance, or other reasons that prevent us from doing so.
This document is being supplied to you solely for your information, and its contents, information or data may not be reproduced,
redistributed or passed on, directly or indirectly.
Neither Angel Broking Pvt. Limited, nor its directors, employees or affiliates shall be liable for any loss or damage that may arise from
or in connection with the use of this information.